Software Metrics
In the previous chapter, we looked at Software Quality Assurance and the various characteristics used to judge whether software is genuinely of high quality, such as reliability, maintainability, and performance efficiency. A natural question follows immediately from this: how do we actually measure any of these characteristics in a concrete, objective way, rather than relying purely on subjective impressions? This is exactly the role that software metrics play in software engineering.
A software metric is a quantitative measure of some attribute of the software process, the project used to build it, or the product itself. Rather than saying a project "seems to be going well" or a piece of code "feels complicated," metrics allow a team to attach an actual number to these ideas, making it possible to track progress objectively, compare results over time, and make informed decisions based on real data rather than guesswork.
Why Software Metrics Matter
Without measurement, it becomes very difficult to answer basic but important questions during a software project: Is the team more productive this month than last month? Is this module more complex, and therefore riskier, than that one? Has code quality actually improved after the last round of reviews? Software metrics give a team the data needed to answer questions like these with evidence, rather than opinion, and they support many of the SQA elements covered in the previous chapter, particularly Errors/Defect Collection Analysis and Risk Management, both of which depend on having real numbers to analyse.
Classification of Software Metrics
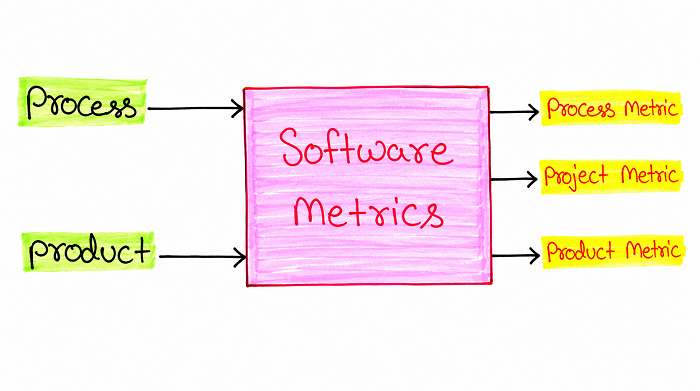
The diagram above illustrates how software metrics are classified, using a simple input-output style representation. On the left, two inputs feed into the central "Software Metrics" box: Process and Product, representing the two broad sources that generate measurable data during software development — the way work is carried out, and what is actually built as a result of that work. On the right, the diagram shows three distinct outputs branching out from the Software Metrics box: Process Metric, Project Metric, and Product Metric.
This visual arrangement captures an important idea: even though the raw information feeding into measurement essentially comes from just two places, how work is done (Process) and what gets built (Product), that information can be analysed and categorised from three distinct angles once it passes through the software metrics process, giving teams three separate lenses through which to understand their work. The sections below explain each of these three metric categories individually.
1. Process Metrics
Process Metrics focus on measuring characteristics of the overall software development process itself, rather than any single project or the resulting product. These metrics are gathered across many projects over a longer period of time, helping an organisation understand how effective its development process generally is, and where it might be improved.
Examples of process metrics include the average time taken to fix a defect once it's reported, the percentage of defects that are discovered before the software is actually released to users, and the effectiveness of a particular review or testing technique at catching errors before they reach later stages of development. Because process metrics look at patterns across multiple projects, they are especially useful for identifying systemic issues in how an organisation builds software, connecting closely to the continuous improvement goals discussed under Errors/Defect Collection Analysis in the previous chapter.
2. Project Metrics
Project Metrics focus on measuring characteristics of a single, specific software project as it progresses, helping a project manager track whether that particular project is on schedule, within budget, and proceeding as planned. Unlike process metrics, which look across many projects over time, project metrics are concerned with the here-and-now status of one project currently underway.
Examples of project metrics include the actual effort spent on a project so far compared to what was originally estimated, the number of requirement changes requested partway through development, and the current schedule status compared to the original project plan. These metrics connect directly to the planning, scheduling, and monitoring concepts covered in the earlier Software Project Management chapter of this series, giving a project manager the concrete data needed to make timely decisions if a project starts to drift off track.
3. Product Metrics
Product Metrics focus on measuring characteristics of the software product itself, the actual artefact being built, rather than the process used to build it or the project's overall progress. These metrics are typically gathered by examining requirement documents, design documents, or the source code directly.
Examples of product metrics include the size of the software, often measured in Lines of Code or using Function Points, the complexity of a particular module, often measured using techniques like Cyclomatic Complexity, and the number of defects found per thousand lines of code, sometimes called defect density. Product metrics connect directly to several of the quality characteristics covered in the previous chapter, since a highly complex module, for example, is often more difficult to maintain and more likely to contain undiscovered defects, tying this chapter's measurements back to the Maintainability and Reliability characteristics discussed earlier.
How the Three Metric Categories Work Together
Although Process, Project, and Product metrics each focus on a different angle, they are most useful when considered together rather than in isolation. A high defect density in a product metric, for instance, might prompt a team to examine their project metrics to see whether that particular module was rushed due to schedule pressure, and to examine their process metrics to see whether their review process is generally effective at catching this kind of issue before release. Used together, these three categories give a much richer, more actionable picture than any single measurement could provide on its own.
Summary Table of Metric Categories
| Category | What It Measures | Example |
|---|---|---|
| Process Metric | The effectiveness of the overall development process, across projects | Average time taken to fix a reported defect |
| Project Metric | The progress and status of a single, specific project | Actual effort spent compared to original estimate |
| Product Metric | Characteristics of the software product itself | Lines of Code, Cyclomatic Complexity, defect density |
Best Practices While Learning Software Metrics
- Anchor each metric category around one simple question — Process asks "how well do we generally work?", Project asks "how is this specific project going?", and Product asks "what have we actually built?"
- Practice classifying real examples into the correct category, since exam questions often describe a scenario and ask which type of metric it represents.
- Connect this chapter back to Software Quality Assurance and Software Project Management, since metrics are really the measurement layer that supports the activities described in both of those chapters.
- Revisit this chapter before studying Risk Management next, since accurate metrics are often what first reveal a risk worth managing.
Common Mistakes Beginners Make
| Mistake | Correct Practice |
|---|---|
| Assuming Process Metrics and Project Metrics are the same thing. | Remember that Process Metrics look at patterns across many projects over time, while Project Metrics track the status of one specific, current project. |
| Treating a single metric, such as Lines of Code, as a complete measure of software quality on its own. | Understand that metrics are most meaningful when several are considered together, rather than relying on any single number in isolation. |
| Believing product metrics can only be gathered after the software is fully built. | Recognise that product metrics can also be gathered earlier, by examining requirement and design documents before coding even begins. |
Frequently Asked Interview Questions
-
What is a software metric?
A software metric is a quantitative measure of some attribute of the software process, the project, or the product itself. -
What are the three main classifications of software metrics?
Software metrics are classified into Process Metrics, Project Metrics, and Product Metrics. -
What is the difference between Process Metrics and Project Metrics?
Process Metrics measure the effectiveness of the overall development process across many projects, while Project Metrics measure the progress and status of one specific, individual project. -
What kind of measurements fall under Product Metrics?
Product Metrics include measurements like the software's size, its complexity, and its defect density, gathered from requirement documents, design documents, or source code. -
Why are software metrics important?
Software metrics allow a team to track progress, compare results objectively, and make informed decisions based on real data rather than subjective impressions. -
How do the three categories of metrics relate to each other?
They are most useful when analysed together, since a finding in one category, such as a high defect density in a product metric, often prompts a closer look at related process or project metrics to understand the underlying cause. -
How does this chapter connect to Software Quality Assurance?
Software metrics provide the concrete, measurable data that supports SQA activities such as defect analysis and risk management, turning quality goals into something that can actually be tracked and verified.
Summary
Software metrics turn the abstract idea of software quality and progress into concrete, measurable data. In this chapter, we looked at how software metrics are classified into three categories, illustrated in the diagram as arising from the two broad inputs of Process and Product: Process Metrics, which measure the overall effectiveness of how an organisation develops software; Project Metrics, which track the progress of one specific project; and Product Metrics, which measure characteristics of the actual software being built, such as its size, complexity, and defect density.
With a solid understanding of how software can be measured, you're now ready to explore Risk Management in the next chapter, which looks at how the kind of data covered here is used to identify, assess, and mitigate risks before they seriously affect a software project.