Entity Relationship Diagram (ER Diagram) in Software Engineering
While Data Flow Diagrams focus on how information moves through a system, they intentionally avoid describing the actual structure of that data in detail. Once a design team needs to understand exactly what pieces of information a system must store, and how those pieces relate to one another, a different kind of diagram becomes necessary: the Entity Relationship Diagram, commonly known as an ER diagram.
An ER diagram provides a clear, visual map of a system's underlying data structure, showing the real-world objects a system needs to track, the properties of those objects, and the meaningful connections between them. This diagram becomes an essential bridge between software design and eventual database design, ensuring that everyone involved shares a consistent understanding of the data a system depends on.
In this tutorial, you will learn what an ER diagram represents, the standard notation used to draw one, how cardinality describes the nature of relationships between entities, and how to approach building an ER diagram step by step during the software design process.
What is an Entity Relationship Diagram?
An Entity Relationship Diagram is a visual representation of the entities within a system, the attributes that describe those entities, and the relationships that connect them to one another. It captures the conceptual structure of a system's data, independent of how that data will eventually be implemented in a specific database technology.
Rather than focusing on processes or data movement, an ER diagram answers a more foundational question: what real-world things does this system need to keep track of, and how are those things connected? For a platform like CS Engineering Gyan, this might mean identifying that students enroll in courses, courses are taught by instructors, and students receive certificates upon completing courses.
Why ER Diagrams Matter in Software Engineering
- They provide a clear, shared understanding of a system's data structure before development begins.
- They help identify all necessary entities and relationships early, reducing the risk of missing important data connections.
- They serve as a bridge between conceptual design and the eventual physical structure of a database.
- They make it easier to communicate complex data relationships to both technical and non-technical stakeholders.
- They help detect design issues, such as missing relationships or unnecessary duplication, before implementation begins.
Core Components of an ER Diagram
ER diagrams are built from a small set of core components, each representing a different aspect of a system's data structure.
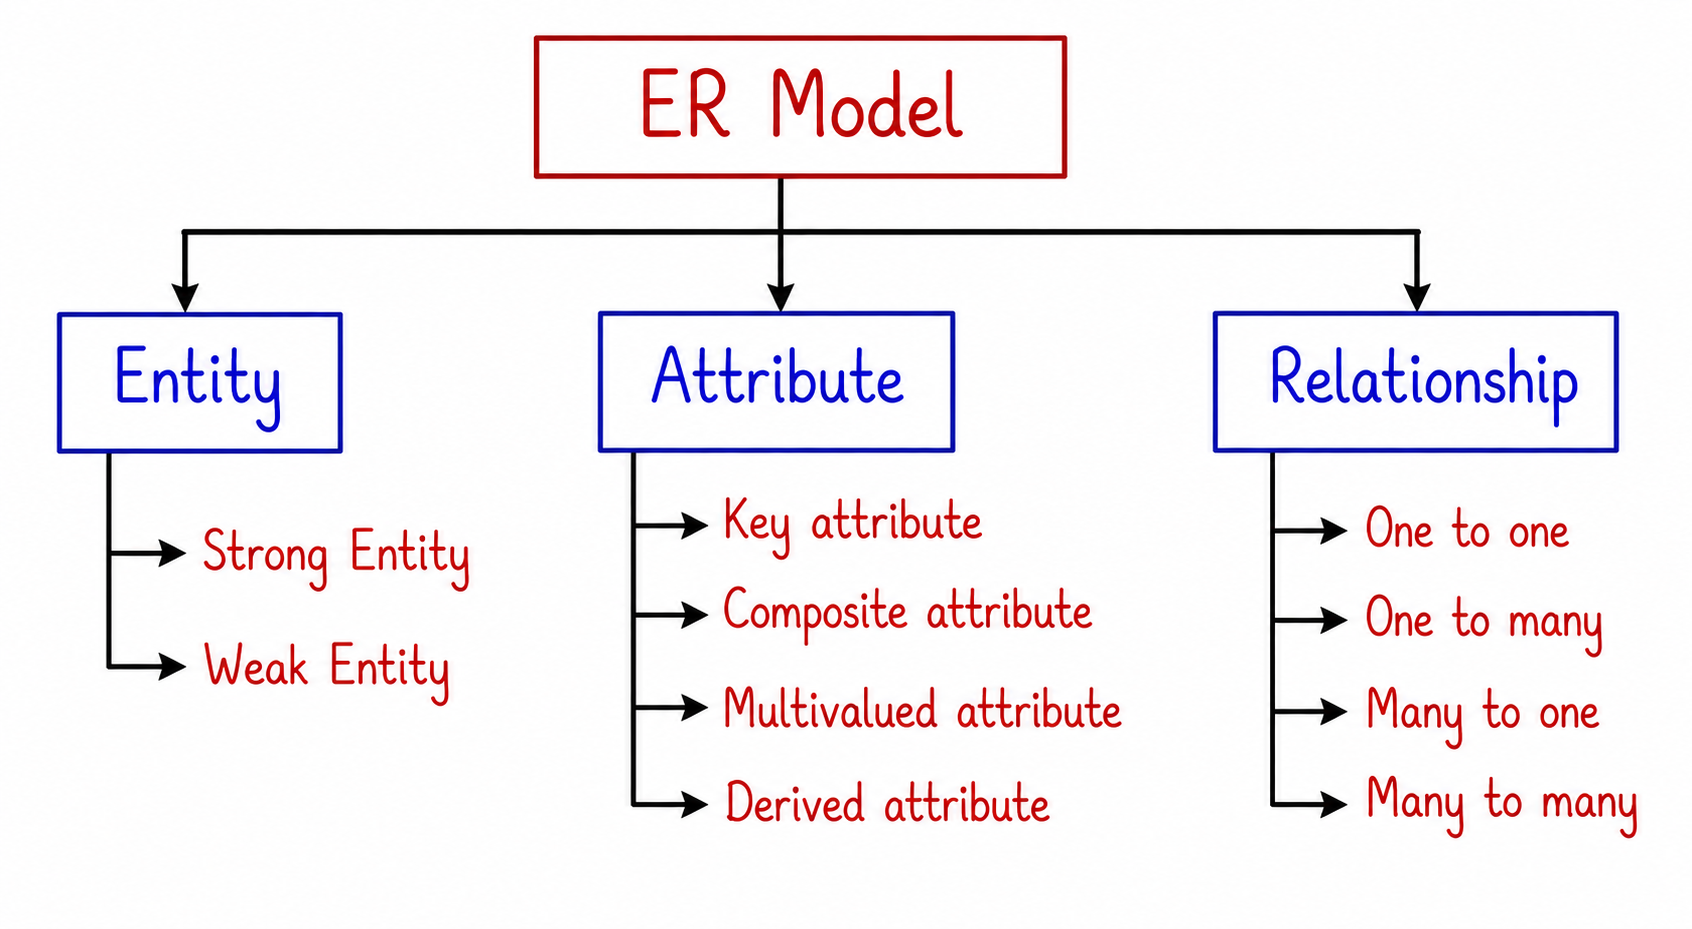
| Component | Typical Shape | Represents |
|---|---|---|
| Entity | Rectangle | A real-world object or concept about which data needs to be stored. |
| Attribute | Oval | A specific property or characteristic that describes an entity. |
| Relationship | Diamond | A meaningful connection or association between two or more entities. |
| Connecting Line | Line | Links entities to their attributes, and entities to their relationships. |
1. Entities
An entity represents a distinct object, person, or concept that a system needs to store information about. Entities generally correspond to the "nouns" involved in describing a system, and each one typically becomes a table once the design is eventually translated into an actual database.
Example
For the CS Engineering Gyan platform, entities might include Student, Course, and Instructor, each representing a distinct concept the system needs to track information about independently.
Types of Entities
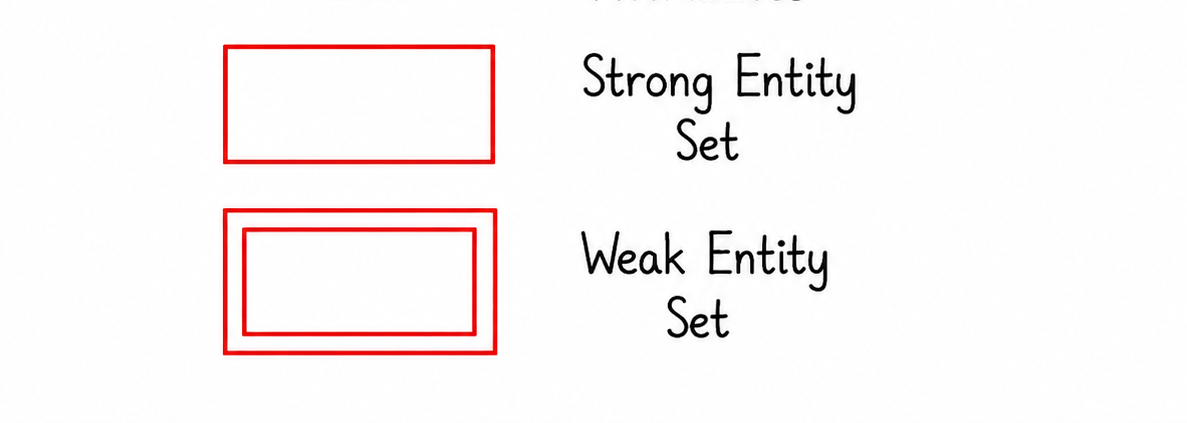
| Entity Type | Description |
|---|---|
| Strong Entity | An entity that can be uniquely identified using its own attributes, without depending on another entity. |
| Weak Entity | An entity that cannot be uniquely identified without relying on its relationship to another entity. |
For example, a Student entity is typically a strong entity, since it can be uniquely identified through its own StudentID. However, if the platform tracked individual Quiz Attempts that only make sense in the context of a specific student and course, this might be modeled as a weak entity, since an attempt record has no independent meaning without being tied to that student and course.
2. Attributes
Attributes describe the specific properties or characteristics of an entity. Every entity typically has several attributes that capture the meaningful details a system needs to store about it.
Example
The Student entity for CS Engineering Gyan might have attributes such as StudentID, Name, Email, and DateOfRegistration, each representing a distinct piece of information describing that student.
Types of Attributes
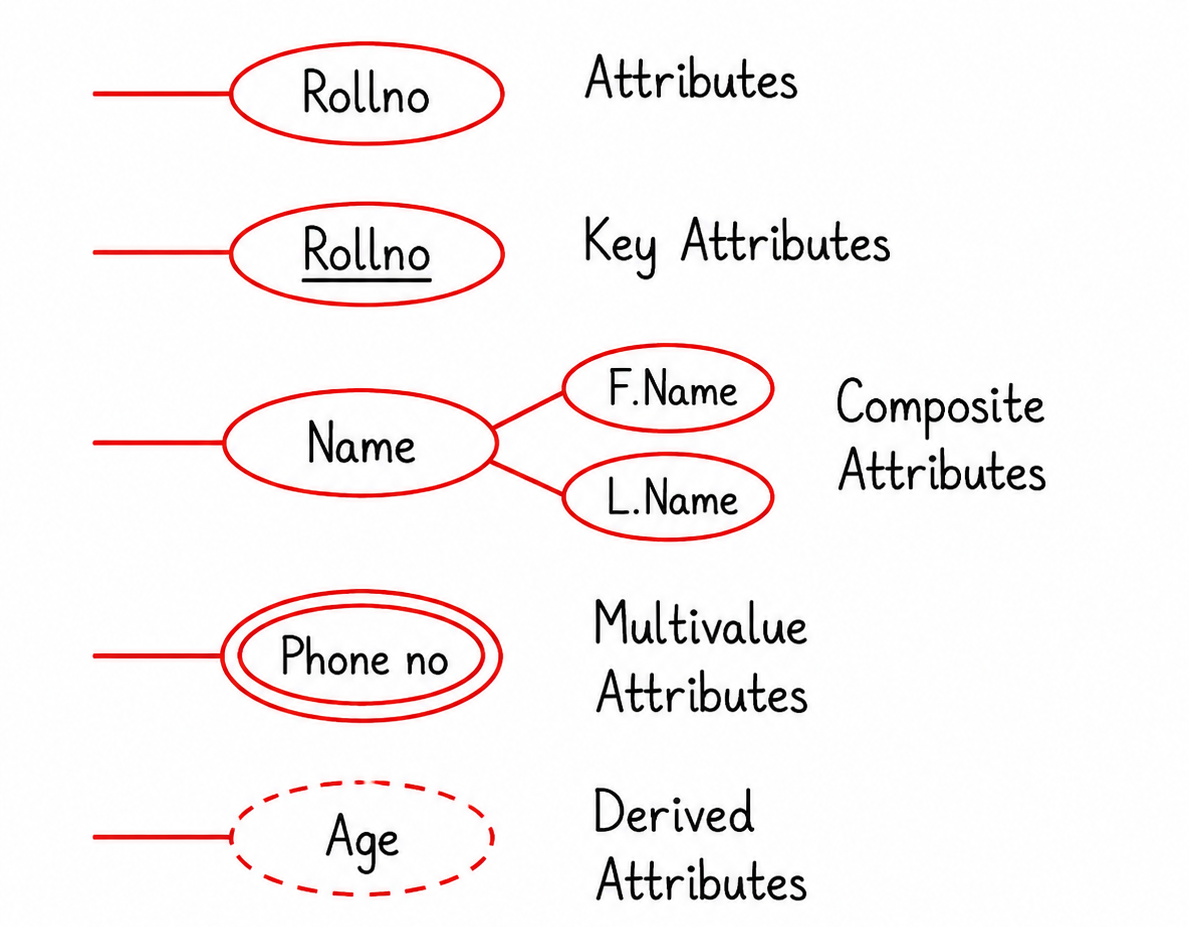
| Attribute Type | Description |
|---|---|
| Simple Attribute | An attribute that cannot be meaningfully divided further, such as Email. |
| Composite Attribute | An attribute that can be broken down into smaller sub-parts, such as splitting Name into FirstName and LastName. |
| Derived Attribute | An attribute whose value can be calculated from other existing attributes, such as calculating a student's course duration from enrollment and completion dates. |
| Multivalued Attribute | An attribute that can hold more than one value for a single entity, such as a student having multiple phone numbers. |
3. Relationships
A relationship represents a meaningful association between two or more entities, describing how they are logically connected within the system. Relationships often correspond to the "verbs" involved in describing how entities interact with one another.
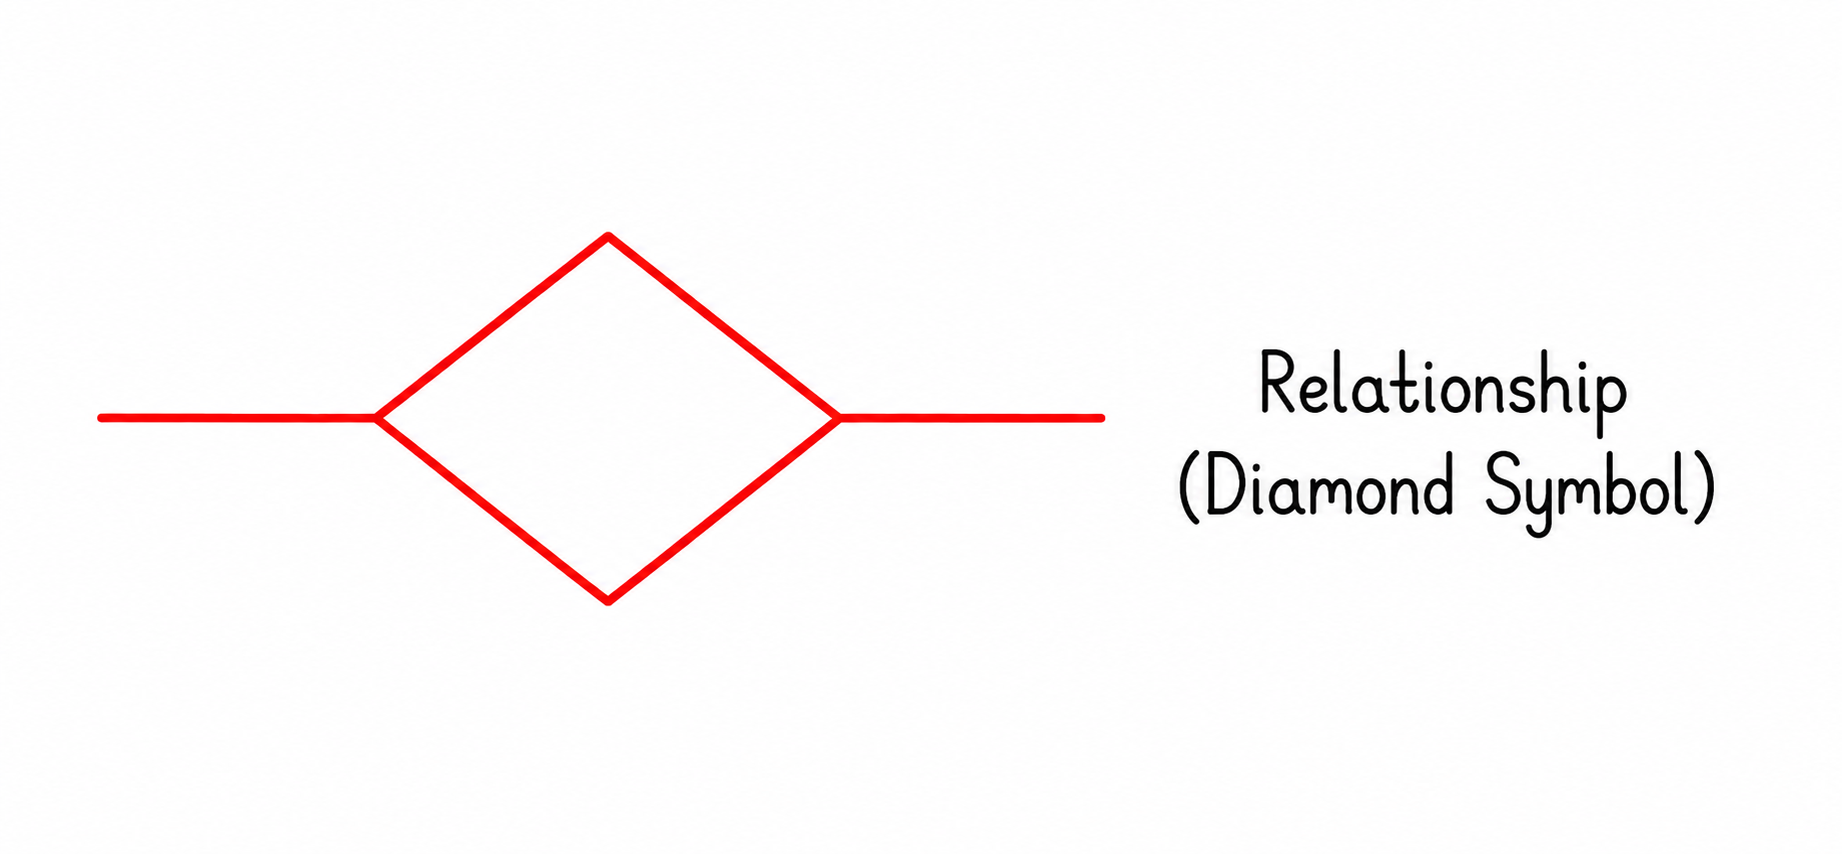
Example
The connection between Student and Course might be captured through a relationship named Enrolls, representing the fact that students enroll in courses, a relationship that becomes meaningful specifically because both entities are involved together.
Cardinality in ER Diagrams
Cardinality describes the numerical nature of a relationship, specifying how many instances of one entity can be associated with how many instances of another entity. Understanding cardinality is essential for accurately modeling real-world relationships within a system.
| Cardinality Type | Description |
|---|---|
| One-to-One (1:1) | A single instance of one entity relates to exactly one instance of another entity. |
| One-to-Many (1:N) | A single instance of one entity relates to multiple instances of another entity. |
| Many-to-Many (M:N) | Multiple instances of one entity relate to multiple instances of another entity. |
Example: One-to-One
If each instructor on the CS Engineering Gyan platform has exactly one dedicated profile page, and each profile page belongs to exactly one instructor, this represents a one-to-one relationship between Instructor and InstructorProfile.
Example: One-to-Many
A single instructor can teach multiple courses, but each course is typically taught by only one primary instructor, representing a one-to-many relationship between Instructor and Course.
Example: Many-to-Many
A single student can enroll in multiple courses, and a single course can have multiple students enrolled in it simultaneously, representing a many-to-many relationship between Student and Course, typically resolved using an intermediate entity such as Enrollment during actual database implementation.
Participation Constraints
Beyond cardinality, ER diagrams can also express whether an entity's participation in a relationship is mandatory or optional, further refining how accurately the diagram reflects real-world business rules.
| Participation Type | Description |
|---|---|
| Total Participation | Every instance of the entity must participate in the relationship. |
| Partial Participation | Some instances of the entity may exist without participating in the relationship. |
For example, if every student on the CS Engineering Gyan platform is required to enroll in at least one course upon registration, this would represent total participation. However, if a newly registered student might not yet be enrolled in any course, this would instead represent partial participation.
Building a Sample ER Diagram: Step by Step
To understand how these components come together, consider building a simplified ER diagram for the course enrollment portion of the CS Engineering Gyan platform.
| Step | Action |
|---|---|
| 1. Identify Entities | Determine the main entities involved, such as Student, Course, and Instructor. |
| 2. Identify Attributes | List the relevant attributes for each entity, such as StudentID and Name for Student. |
| 3. Identify Relationships | Determine how entities are connected, such as Student Enrolls In Course. |
| 4. Determine Cardinality | Decide whether each relationship is one-to-one, one-to-many, or many-to-many. |
| 5. Determine Participation | Decide whether participation in each relationship is total or partial for each entity. |
Following this process for the CS Engineering Gyan example would result in a diagram showing Student and Course connected through an Enrolls relationship with many-to-many cardinality, along with Instructor connected to Course through a Teaches relationship with one-to-many cardinality, each entity displaying its relevant attributes.
ER Diagrams and Database Design
One of the most valuable aspects of an ER diagram is how directly it translates into an actual relational database structure. Entities generally become tables, attributes generally become columns, and relationships, particularly many-to-many relationships, often become separate linking tables during implementation.
This close relationship between conceptual ER diagrams and physical database design is why ER diagrams are typically created during the software design phase, serving as a shared reference point before developers begin writing actual database schemas.
Comparing ER Diagrams and Data Flow Diagrams
| ER Diagram | Data Flow Diagram |
|---|---|
| Focuses on the structure of data and relationships between entities. | Focuses on how data moves between processes within a system. |
| Answers the question: what data exists, and how is it connected? | Answers the question: how does data travel through the system? |
| Closely tied to eventual database design. | Closely tied to understanding system processes and workflows. |
Both diagrams complement each other well during software design, with the ER diagram clarifying what data a system depends on, and the DFD clarifying how that data actually flows through the system's various processes.
Best Practices for Creating ER Diagrams
- Identify entities based on genuinely distinct real-world concepts, rather than splitting things unnecessarily.
- Choose attribute names that clearly describe the specific piece of information they represent.
- Carefully determine cardinality by considering realistic business scenarios, rather than assuming default relationships.
- Use participation constraints to capture important business rules, such as whether a relationship is mandatory.
- Review the diagram with stakeholders familiar with the actual business domain to confirm its accuracy.
Common Mistakes Beginners Make
| Mistake | Correct Practice |
|---|---|
| Confusing entities with attributes. | Remember that entities represent independent objects, while attributes describe properties of those objects. |
| Assuming every relationship is one-to-one by default. | Carefully evaluate real-world scenarios to determine the actual cardinality of each relationship. |
| Ignoring participation constraints when modeling relationships. | Consider whether participation should be total or partial based on actual business rules. |
| Creating overly complex diagrams without breaking them into manageable sections. | Focus on one meaningful portion of the system at a time when diagrams become large. |
Frequently Asked Questions
-
What is an Entity Relationship Diagram used for?
It is used to visually represent the entities, attributes, and relationships that describe a system's underlying data structure. -
What is the difference between an entity and an attribute?
An entity represents an independent object or concept, while an attribute describes a specific property of that entity. -
What is the difference between a strong entity and a weak entity?
A strong entity can be uniquely identified on its own, while a weak entity depends on its relationship to another entity for unique identification. -
What does cardinality represent in an ER diagram?
Cardinality describes how many instances of one entity can be associated with how many instances of another entity. -
What is the difference between total and partial participation?
Total participation means every instance of an entity must take part in a relationship, while partial participation means some instances may not. -
How does an ER diagram relate to actual database design?
Entities typically become tables, attributes become columns, and relationships often become linking tables during physical database implementation. -
What is the difference between an ER diagram and a Data Flow Diagram?
An ER diagram focuses on the structure of data and its relationships, while a DFD focuses on how data moves through system processes. -
Why is a many-to-many relationship often resolved with an additional entity during implementation?
Because relational databases typically require a linking table to properly represent many-to-many relationships between two entities.
Summary
Entity Relationship Diagrams provide a clear, structured way to represent the entities, attributes, and relationships that define a system's data, forming an essential part of the software design process. By identifying entities, describing them with attributes, and connecting them through relationships with appropriate cardinality and participation constraints, teams gain a shared understanding of exactly what data a system, such as a platform like CS Engineering Gyan, needs to manage.
This conceptual clarity becomes especially valuable once development moves toward actual database design, since ER diagrams translate naturally into relational database structures, with entities becoming tables and relationships shaping how those tables connect to one another. Investing time in a well-constructed ER diagram helps prevent structural data problems that would otherwise be far more difficult and costly to fix after implementation.
With a solid understanding of Entity Relationship Diagrams, you are now ready to explore the Unified Modeling Language, which extends visual modeling beyond data structure into a broader set of diagrams representing system behavior and interactions.